In a previous blog, “On-prem Conditional Access You Never Knew You Had” I explored how the built-in Windows Firewall can be used as a powerful control mechanism to restrict access to systems, effectively bringing conditional access concepts to on-premises environments. The response to that post was overwhelming, with over 23,000 views on Reddit alone. Clearly, many organizations are interested in rethinking how they use the Windows Firewall beyond its default, often permissive configuration, and so should you/ But before you can confidently start restricting access, there is a fundamental question you need to answer:
What is actually being used in your environment?
In many cases, firewall rules have grown organically over time. Ports are opened “temporarily,” (read: we forget, so they will be open forever) exceptions are made for specific systems, and over the years, the rule set becomes difficult to understand, let alone control or optimize. Tightening those rules without proper insight is risky and can easily break critical services.
Fortunately, the Windows Firewall already contains the data you need to make informed decisions. With the right setup, you can collect and analyze firewall logs to understand which ports, protocols, and systems are actively in use. In this blog, I’ll show how to centralize Windows Firewall logs from on-premises servers using Azure Arc and Azure Monitor, and how to use KQL to turn raw log data into actionable insights.
Let’s dive in!
Architecture
To gain visibility into actual network usage, I set up a simple hybrid monitoring solution using Azure Monitor. The goal was not to build a full SIEM, but to quickly collect and analyze Windows Firewall logs from on-premises systems.
The setup consists of the following components:
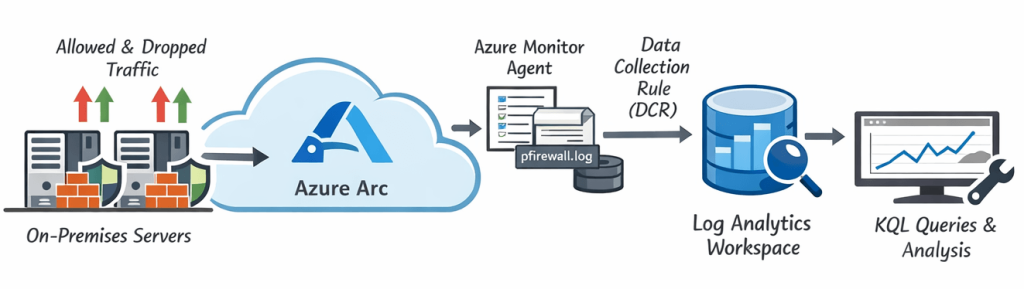
- Windows Firewall logging enabled on the servers
- Azure Arc to onboard on-premises systems into Azure
- Azure Monitor Agent (AMA) for log collection
- Data Collection Rules (DCR) to define what data is collected
- Log Analytics Workspace as the central data store
Together, this allows firewall logs generated on on-premises systems to be forwarded to Azure, where they can be queried using KQL.
Windows firewall logging
The first step is enabling logging in the Windows Firewall. By default, logging is either disabled or limited, but it can be configured to log both allowed and dropped connections. For this setup, both successful and dropped connections will be enabled to provide a complete view of network activity.
Azure Arc & Azure Monitor Agent
To collect logs from on-premises systems, the servers are onboarded into Azure using Azure Arc. This makes them manageable as Azure resources. Once onboarded, the Azure Monitor Agent (AMA) will be deployed as an extension. This agent is responsible for collecting data from the system and forwarding it to Azure based on defined collection rules.
Data collection rules
Data Collection Rules (DCRs) define which data is collected and where it is sent. In this case, the firewall log file will be ingested and forwarded to a Log Analytics Workspace. One important observation during setup is that not all environments support the same ingestion methods out-of-the-box. In some cases, the default Windows Firewall table may not be immediately available. As a reliable alternative, custom log ingestion can be used to ensure the firewall logs are consistently collected, but in this case I’ll stick to the supported way.
Log Analytics Workspace
All collected data is stored in a Log Analytics Workspace, where it can be queried using KQL. This provides a central place to analyze firewall activity across multiple systems and identify actual network usage patterns.
This setup provides a lightweight but powerful way to gain visibility into network traffic without deploying a full monitoring or SIEM solution. More importantly, it enables data-driven decisions when tightening firewall rules, instead of relying on assumptions or outdated documentation.
Enabling Windows Firewall logging
Before you can collect and analyze firewall data, you first need to ensure that logging is enabled on the Windows Firewall. By default, logging is often disabled or only partially configured, which means valuable information about network activity is simply not recorded. For this setup, both allowed and dropped connections will be enabled to provide a complete view of traffic. The logs are written to:
C:\Windows\System32\LogFiles\Firewall\pfirewall.logConfiguration (quick method)
For a quick and dirty (read: none manageable way) you can use the two netsh commands below to enable logging. This is fine on a single machine, but it would make more sense to do this via group policy management.
netsh advfirewall set allprofiles logging allowedconnections enable
netsh advfirewall set allprofiles logging droppedconnections enable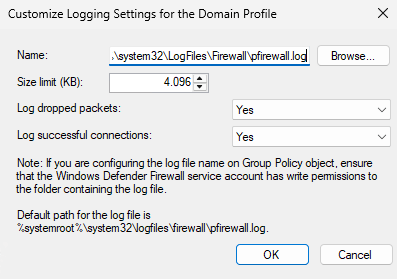
Group Policy (recommended for production)
In production environments, firewall logging should be configured using Group Policy to ensure consistency across systems. Navigate to:
Computer Configuration → Policies → Windows Settings → Security Settings
→ Windows Defender Firewall with Advanced Security → Windows Defender Firewall with Advanced Security – LDAP://… → Domain Profile
- Right click “Windows Defender Firewall” select “Properties“
- Set the “Firewall state” for the “Domain Profile” to “On (recommended)“
- Set “Inbound connections” to “Block (default)“
- Set “Outbound connections” to “Allow (default)”
- Go to “Settings” section, click “Customize“
- In “Rule merging“, set “Apply local firewall rules” to “No“, click “OK“
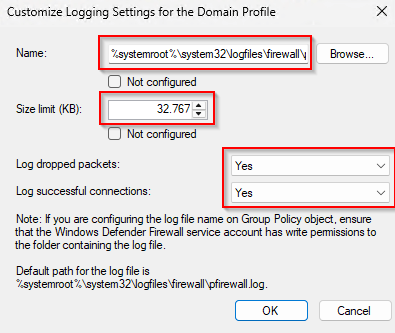
- Go to the “Logging” section, click “Customize“
Enable these settings:
- Name:
C:\Windows\System32\LogFiles\Firewall\pfirewall.log - Log dropped packets:
Yes - Log successful connections:
Yes - Log file size limit (KB):
32.767(max)
After applying the Group Policy, verify that logging is active by opening an elevated terminal and using the following command:
Get-Content C:\Windows\System32\LogFiles\Firewall\pfirewall.log -Tail 20If configured correctly, new entries should appear as network activity occurs. In many environments, only dropped traffic is logged by default. While useful, this provides only half the picture. Enabling successful connection logging reveals which ports are actually in use
What if the Windows Firewall is disabled?
In some environments, the Windows Firewall is completely disabled. This is often done to “avoid breaking things,” especially in environments where dependencies are not fully understood. However, disabling the firewall also means that no logging takes place, effectively removing all visibility into network traffic at the host level. It also breaks other services that are depended on this service running, don’t disable the Windows Firewall Service!
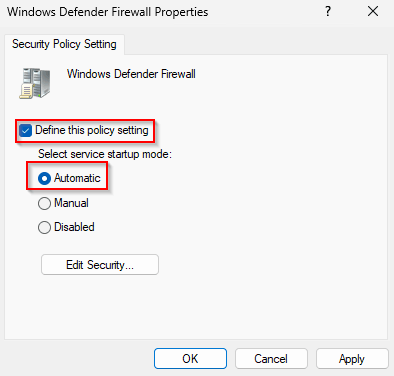
Enable the Windows Firewall service (MpsSvc)
Enable the service via a GPO in this location:
Computer Configuration → Policies → Windows Settings → Security Settings → System Services → Windows Defender Firewall
- Startup mode:
Automatic - Service status:
Started
Allow all inbound traffic (any:any rule)
Enable the rule via:
Computer Configuration → Policies → Windows Settings → Security Settings
→ Windows Defender Firewall with Advanced Security → Windows Defender Firewall with Advanced Security – LDAP://… → Domain Profile → Inbound Rules → “New Rule…“
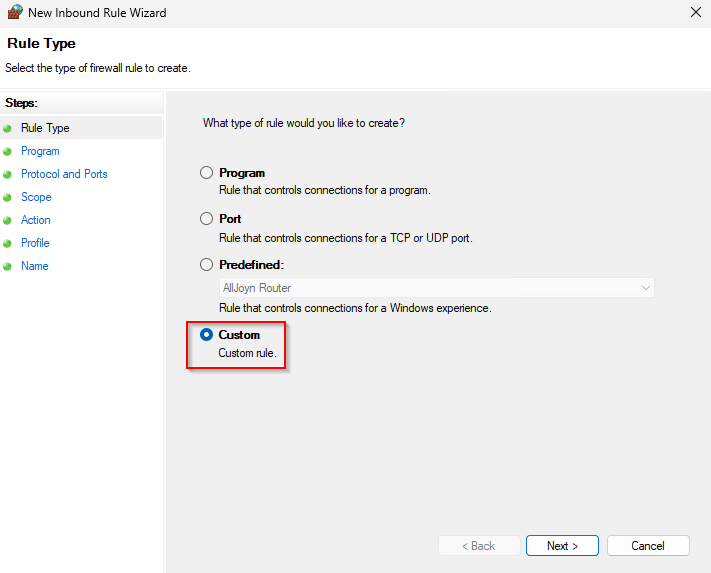
In the “New Connection Security Rule Wizard“, select “Custom“, Click “Next“
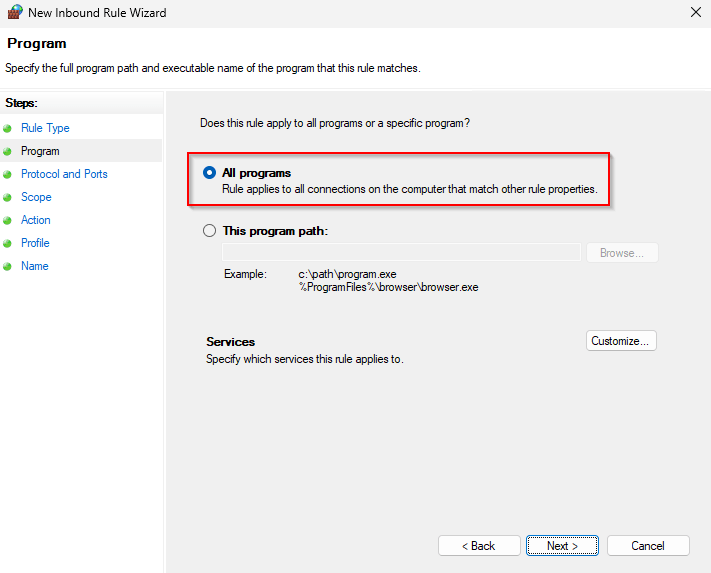
Select “All programs“, click “Next“
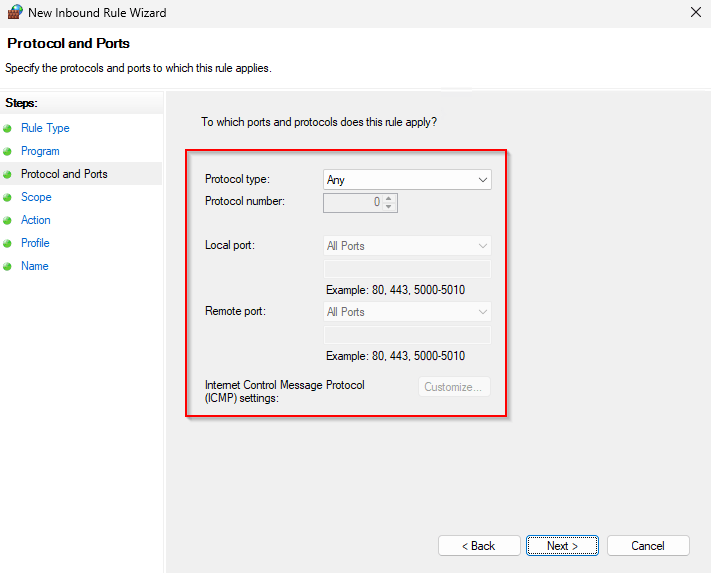
Accept the defaults and click “Next“
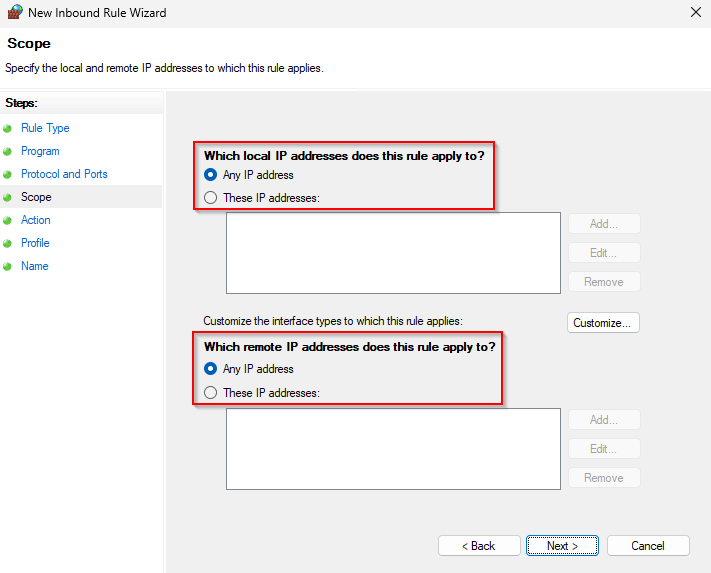
Accept the defaults and click “Next“
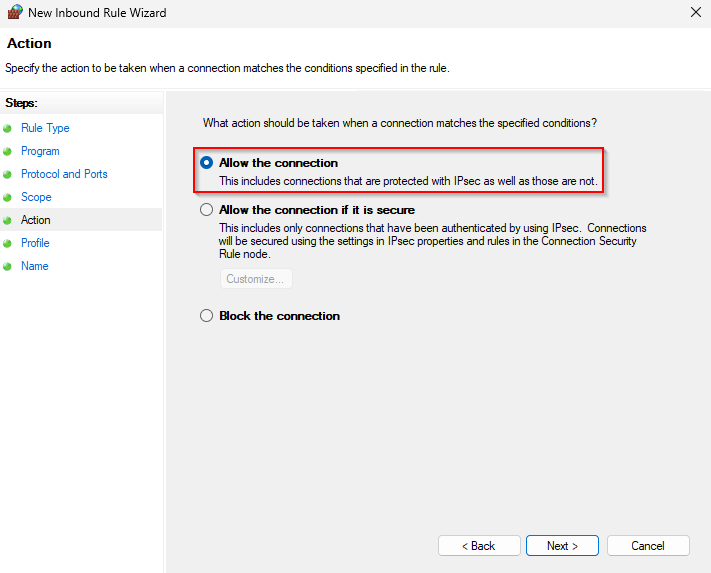
Select “Allow the connection“, click “Next“
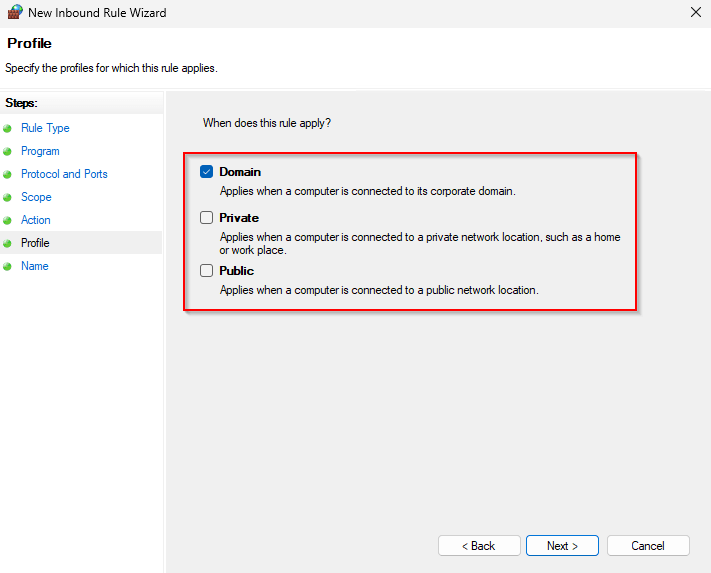
Deselect “Private” and “Public“, click “Next“
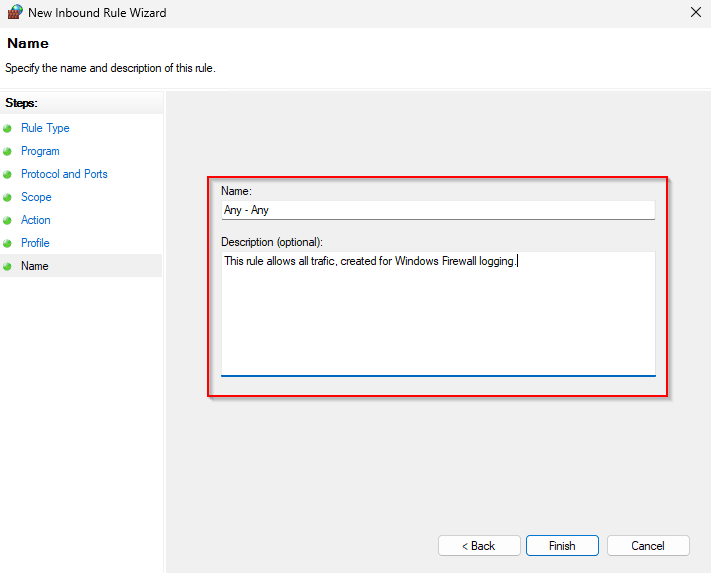
Set a “Name” and “Description“, click “Finish“
Apply the policy to the appropriate organizational unit and wait for the policy refresh to occur, or use “gpupdate /force” on the target. Now that we have logging enable, let’s move to Azure and setup the infrastructure for logging!
Note! Once sufficient data has been collected, the “Any – Any” rule should be removed and replaced with more restrictive, data-driven rules.
Centralizing firewall logs with Azure Monitor
With firewall logging enabled on the servers, the next step is to centralize these logs and make them searchable. For this, I used Azure Monitor in combination with Azure Arc to collect and analyze firewall data from on-premises systems.
Prerequisites
Before starting, the following components are required:
- An Azure subscription
- A resource group (e.g.
rg-monitoring-hybrid) - A Log Analytics Workspace (e.g.
law-hybrid-firewall-prod) - A test server (on-premises)
- Permissions in Azure to create resources
- Outbound internet connectivity from the server to Azure
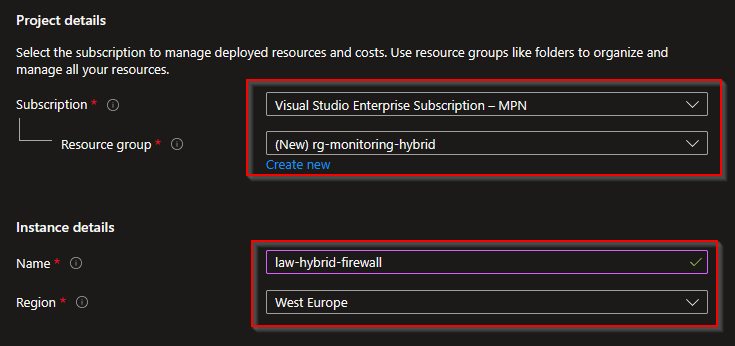
Step 1 – Creating the Log Analytics Workspace
The Log Analytics Workspace acts as the central data store for all collected logs. In the Azure Portal:
- Search for “Log Analytics workspaces“
- Click “Create“
- Select your subscription
- Select or create a resource group
"rg-monitoring-hybrid“ - Enter a name “law-hybrid-firewall“
- Select a region (in my case “West Europe“)
- Click “Review + Create” → “Create“
- Wait for the deployment to succeed and progress to the next step
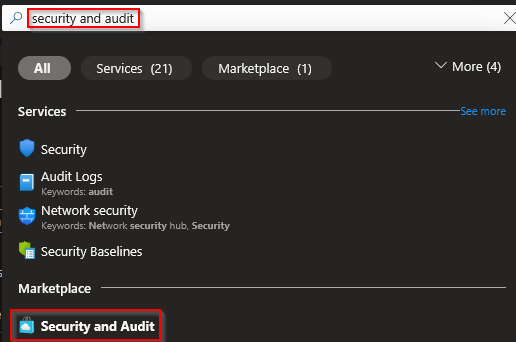
Important note on Firewall Logs
Depending on your environment, the default WindowsFirewall table may not always be available immediately, well usually it’s not available anyway and you will need to enable this resource from the marketplace. This enables the required backend components for firewall log ingestion. First search for “Security and Audit“.
In the “Select Workspace” page set:
- Subscription: “Visual Studio Enterprise Subscription – MPN“
- Resource Group: “rg-monitoring-hybrid“
- Log Analytics Workspace: “law-hybrid-firewall“
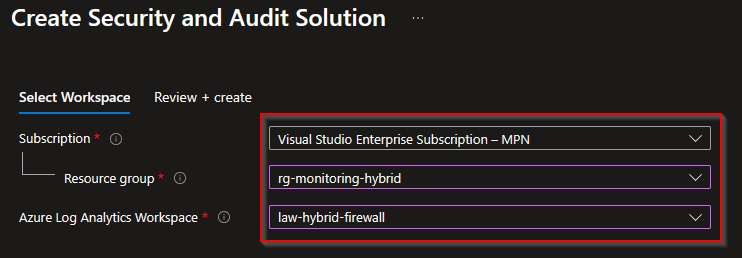
- Click “Review + Create” → “Create“
- Wait for the deployment to succeed and progress to the next step
Onboarding the server with Azure Arc
Azure Arc is used to onboard on-premises (hybrid) servers into Azure, allowing them to be managed like native Azure resources.
- In the Azure Portal
- Search for “Machines – Azure Arc“
- Click “Onboard/Create“
- Select “Onboard existing machines“
- Choose:
- Subscription: “Visual Studio Enterprise Subscription – MPN“
- Resource Group: “rg-monitoring-hybrid“
- Region: “(Europe) West Europe“
- Operating System: “Windows”
- Connect SQL Server: deselect the checkbox
- Connectivity method: “Public endpoint“
- Arc gateway resource: Leave empty
- Authentication: “Authenticate machines manually” (we do this for the demo only)
- Click “Download and run script“
- Copy or download the script content.
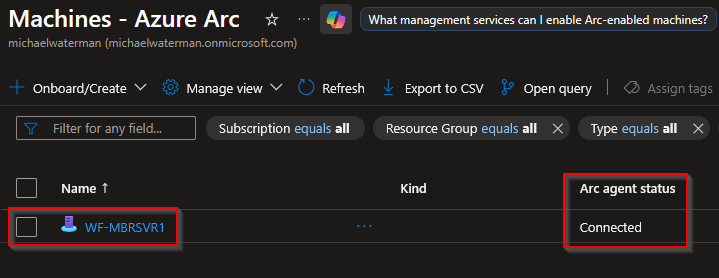
On the server, open an elevated Powershell and run the script using these commands:
Set-ExecutionPolicy -ExecutionPolicy Bypass
.\OnboardingScript.ps1Complete authentication in the browser. After completion you should see the message “Authentication complete. You can return to the application. Feel free to close this browser tab.“, the server will appear as “Connected” in Azure.
Installing the Azure Monitor Agent
The Azure Monitor Agent (AMA) is responsible for collecting data and forwarding it to Azure. It needs to be installed as a extension first.
- Open the Arc-enabled server in the Azure Portal
- Go to: Settings → Extensions → Add
- Select: Azure Monitor Agent for Windows (Recommended)
- Click “Review + Create” → “Create“
- Wait for the deployment to succeed and progress to the next step
Creating a Data Collection Endpoint (DCE)
A Data Collection Endpoint is required for modern Azure Monitor data ingestion.
- Do a search for “Monitor” and click on the service.
- Click “Settings” → “Data Collection Endpoints” → Click “Create“
- Choose:
- Endpoint Name:
dce-windows-firewall - Subscription: “Visual Studio Enterprise Subscription – MPN“
- Resource Group: “rg-monitoring-hybrid“
- Region: “(Europe) West Europe“
- Endpoint Name:
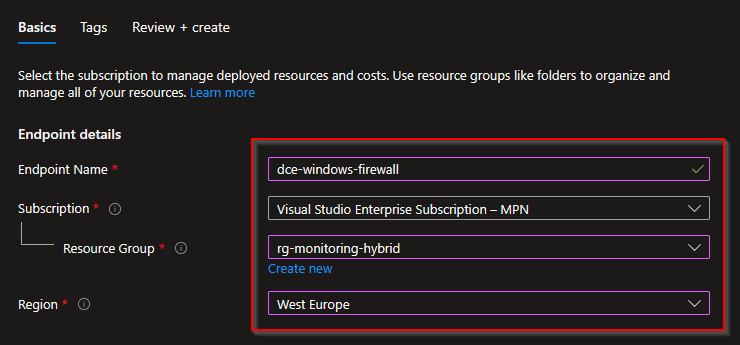
- Click “Review + Create” → “Create“
- Wait for the deployment to succeed and progress to the next step
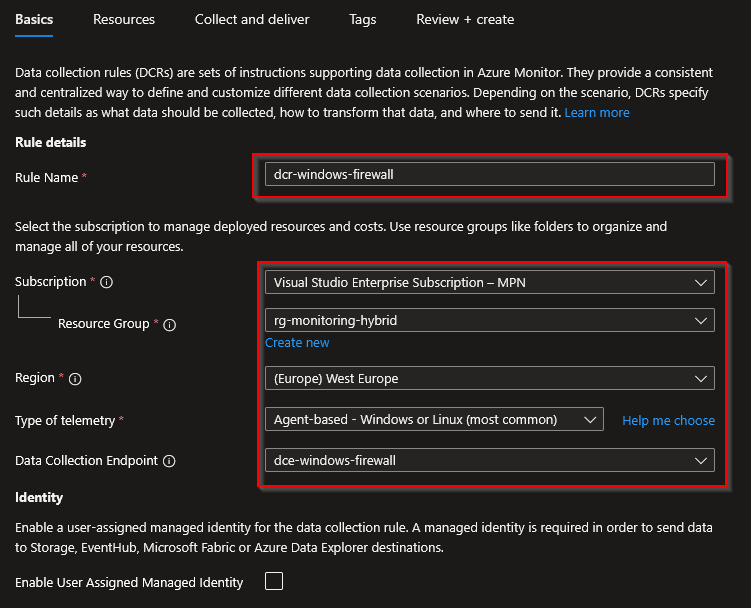
Creating the Data Collection Rule (DCR)
The Data Collection Rule defines which data is collected and where it is sent, in our case that will be the Windows Firewall log.
- Do a search for “Monitor” and click on the service.
- Click “Settings” → “Data Collection Rules” → Click “Create“
- Choose:
- Rule Name: “dcr-windows-firewall”
- Subscription: “Visual Studio Enterprise Subscription – MPN“
- Resource Group: “rg-monitoring-hybrid“
- Region: “(Europe) West Europe“
- Type of telemetry: “Agent-based – Windows or Linux (most common“
- Data Collection Endpoint: “dce-windows-firewall”
- Enable User Assigned Managed Identity: Leave unchecked
- Click “Next“
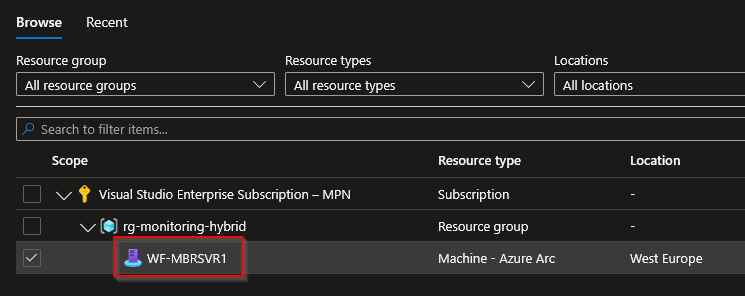
- Click “Add resource“
- Select your Arc server (e.g.
WF-MBRSVR1), click “Apply“, click “Next“
- Click “Add new data source”
- Data source type: “Firewall Logs“, select “Domain“, click “Destination”
- Click “Add destination”
- Destination type: “Log analytics Workspace”
- Subscription: “Visual Studio Enterprise Subscription – MPN“
- Log Analytics Workspace: “law-hybrid-firewall (rg-monitoring-hybrid)“
- Click “Apply”, Click “Save”
- Click “Review + Create” → “Create“
- Wait for the deployment to succeed and progress to the next step
And that’s it! After deployment, it can take up to 15 minutes before data becomes visible, so grab some coffee or tea and wait for a bit.
Verifying the setup
After a while data should be uploaded to your newly created workspace. All we need to do now is the analysis. For that, open the Azure portal again and select “Monitor“, click on the “Logs” node. The first time you are greeted with a “Select a scope” dialog screen. I suggest you select the resource group level, click “Apply“.
Note! Make sure that network traffic has been generated so that the log analytics workspace actually receives data that we can work with. I’ve created some KQL queries that you can use to validate and analyze the data.
Verify Agent connectivity
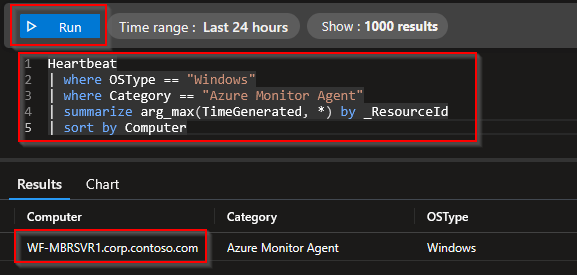
Heartbeat
| where OSType == "Windows"
| where Category == "Azure Monitor Agent"
| summarize arg_max(TimeGenerated, *) by _ResourceId
| sort by ComputerCopy the data into the code field, click “Run” and see if your hybrid server is generating data as in the example below.
When creating custom KQL code, it’s beneficial to know which tables you can actually use. Now there are two ways to see the tables, open the UI, or use this KQL query to see the schema and data types that you can work with.
WindowsFirewall
| getschema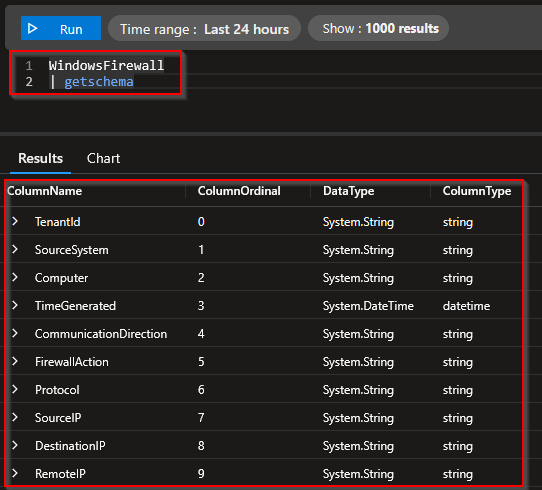
KQL Queries
The following are a couple of KQL queries examples that you can use to make sense of all the network traffic that you will need to analyze and eventually create Group Polices for, have fun 😉
Top destination ports
WindowsFirewall
| summarize Hits=count() by DestinationPort, Protocol
| order by Hits descAllowed vs blocked traffic
WindowsFirewall
| summarize Hits=count() by FirewallAction
| order by Hits descTop used ports, selected on action (Allow or Deny) per protocol
WindowsFirewall
| summarize Hits=count() by SourcePort, DestinationPort, Protocol, FirewallAction
| order by Hits descSelect inbound traffic per port, exclude ephemeral ports
WindowsFirewall
| where CommunicationDirection == "RECEIVE"
| where DestinationPort between (1 .. 49151)
| summarize Hits=count() by Computer, DestinationPort, Protocol
| order by Computer asc, Hits descSelect inbound traffic per port, exclude ephemeral and local ports
WindowsFirewall
| where CommunicationDirection == "RECEIVE"
| where DestinationPort between (1 .. 49151)
| where not(SourceIP startswith "127.")
| where SourceIP != "::1"
| where not(DestinationIP startswith "127.")
| where DestinationIP != "::1"
| summarize Hits=count() by Computer, DestinationPort, Protocol
| order by Computer asc, Hits descTop source IP’s
WindowsFirewall
| summarize Hits=count() by SourceIP
| order by Hits descTop destination IP’s
WindowsFirewall
| where not(SourceIP startswith "127.")
| where SourceIP != "::1"
| summarize Hits=count() by SourceIP, DestinationIP, DestinationPort, Protocol
| order by Hits descShow only blocked traffic
WindowsFirewall
| where FirewallAction =~ "DROP" or FirewallAction =~ "DROPPED" or FirewallAction =~ "BLOCK"
| summarize Hits=count() by DestinationPort, Protocol, SourceIP, DestinationIP
| order by Hits descByte based data streams
WindowsFirewall
| summarize TotalBytes=sum(RequestSizeInBytes) by DestinationPort, Protocol
| order by TotalBytes descRDP, SMB and WinRM check
WindowsFirewall
| where DestinationPort in (3389, 445, 5985, 5986)
| summarize Hits=count() by DestinationPort, Protocol, FirewallAction, Computer
| order by Hits descTraffic per server, per destination port
WindowsFirewall
| where TimeGenerated > ago(60d)
| where DestinationPort between (1 .. 4915)
| where SourceIP !in ("127.0.0.1", "::1")
| where not(DestinationIP endswith ".255")
| where FirewallAction in~ ("ALLOW", "DROP")
| where Protocol in~ ("UDP", "TCP", "ICMP")
| where DestinationIP startswith "192."
| project Computer, DestinationPort, Protocol, DestinationIP, SourceIP, FirewallAction, CommunicationDirection, TimeGenerated
| distinct Computer, DestinationPort, Protocol, DestinationIP, SourceIP, FirewallAction, CommunicationDirection
| sort by Computer asc, DestinationPort asc nulls lastWho pinged me?
WindowsFirewall
| where Protocol == "ICMP"
| where CommunicationDirection == "RECEIVE"
| summarize Hits=count() by Computer, SourceIP
| order by Computer asc, Hits descWho Connected over RDP?
WindowsFirewall
| where Protocol == "TCP"
| where CommunicationDirection == "RECEIVE"
| where DestinationPort == 3389
| summarize Hits=count(), FirstSeen=min(TimeGenerated), LastSeen=max(TimeGenerated)
by Computer, SourceIP, FirewallAction
| order by Computer asc, Hits descWho connected over WinRM?
WindowsFirewall
| where Protocol == "TCP"
| where CommunicationDirection == "RECEIVE"
| where DestinationPort in (5985, 5986)
| summarize Hits=count(), FirstSeen=min(TimeGenerated), LastSeen=max(TimeGenerated)
by Computer, SourceIP, DestinationPort, FirewallAction
| order by Hits descTop IPs that connected over WinRM
WindowsFirewall
| where Protocol == "TCP"
| where CommunicationDirection == "RECEIVE"
| where DestinationPort in (5985, 5986)
| summarize Hits=count() by SourceIP
| order by Hits descWho tried to connect to WinRM but wasn’t allowed?
Blocked WINRM sessions
WindowsFirewall
| where Protocol == "TCP"
| where CommunicationDirection == "RECEIVE"
| where DestinationPort in (5985, 5986)
| where FirewallAction =~ "DROP"
| summarize Hits=count() by SourceIP, Computer, DestinationPort
| order by Hits descThe all in one for WinRM
WindowsFirewall
| where Protocol == "TCP"
| where CommunicationDirection == "RECEIVE"
| where DestinationPort in (5985, 5986)
| summarize Hits=count(), FirstSeen=min(TimeGenerated), LastSeen=max(TimeGenerated)
by Computer, SourceIP, DestinationPort, FirewallAction
| order by Hits descOne machine to multiple Servers at once
WindowsFirewall
| where Protocol == "TCP"
| where CommunicationDirection == "RECEIVE"
| where DestinationPort == 445
| summarize Servers=dcount(Computer), Hits=count() by SourceIP
| where Servers > 3
| order by Servers descLocal troubleshooting
While centralizing firewall logs provides valuable insights across your environment, there are situations where you need to zoom in on a single system. or perhaps you need to troubleshoot, or validate your findings. I’ll share what I’ve learned (or remembered I already knew, the famous, “Oh right” moments) while creating this blog.
Identifying listening ports
A simple starting point is to check which ports are actively listening on a system.
netstat -anoOr filter for a specific port:
netstat -ano | findstr 22The output cloud be something like:
TCP 0.0.0.0:22 0.0.0.0:0 LISTENING 5808This shows that a process is actively listening on port 22.
Mapping ports to processes
To identify which application is responsible, map the process ID (PID) to a process:
tasklist /FI "PID eq 5808"Result: sshd.exe (Open SSH)
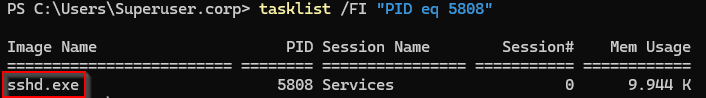
In this case, the port was used by the the open ssh agent, listening only on the interface. Try to remember these important rules:
- Not all high ports are ephemeral
- Not all listening ports are externally exposed
- Some services only listen on localhost (127.0.0.1 / ::1)
These ports are typically used for local inter-process communication and are not accessible from the network and don’t need to be exposed in the firewall.
Advanced port analysis with PowerShell
To simplify this process, I previously created a PowerShell (of course I did) script that provides a more complete overview of network connections and associated processes. This script combines information such as:
- Local and remote ports
- Source and destination IPs
- Associated processes
- Connection states
This makes it significantly easier to identify which services are responsible for network activity. You can download the script from my Github, here:
https://github.com/mfgjwaterman/Powershell/blob/master/Scripts/Get-NetPortsProperties.ps1
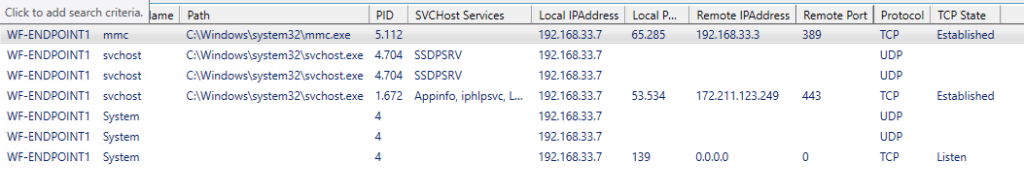
The PowerShell combines the troubleshooting steps above and presents them in a user friendly interface. This makes it a flexible tool for both quick checks and deeper troubleshooting. During testing, I encountered several high-numbered ports that initially appeared to be random or ephemeral. However, local inspection revealed that these ports were actively used by system components such as the Azure Arc agent. Without correlating firewall logs with local system data, these would have been misinterpreted as noise.
Closing thought
Gaining visibility is often the most overlooked step in improving security. In many environments, firewall rules are based on assumptions, legacy decisions, or simply “what has always worked.” But without understanding actual network behavior, tightening those rules becomes a guessing game. By combining Windows Firewall logging with Azure Monitor, it becomes possible to move from assumptions to data-driven decisions. Not by blocking everything at once, but by first understanding what is truly needed.
And as shown throughout this blog, sometimes the most interesting findings come from the unexpected, a high port that turns out to be a system component, or traffic patterns that reveal how systems really interact. Visibility is not the end goal, but it is the foundation. From here, the next step is clear: understanding not just which ports are used, but which processes are responsible for that traffic.
As always, I hope this blog post was useful to you! If you have any questions, remarks or feedback, please let me know and until next time!
References
https://learn.microsoft.com/en-us/azure/azure-monitor/logs/quick-create-workspace?tabs=azure-portal
https://learn.microsoft.com/en-us/azure/azure-arc/servers/quick-enable-hybrid-vm
https://learn.microsoft.com/en-us/azure/azure-monitor/agents/azure-monitor-agent-manage?tabs=azure-portal
https://learn.microsoft.com/en-us/azure/azure-monitor/data-collection/data-collection-rule-overview
https://learn.microsoft.com/en-us/kusto/query/?view=microsoft-fabric
Leave a Reply